Reports Our Customers Love
In this article, we present a few reports that have been voted the “most loved” by our customers. These reports are so popular because they provide the kind of information that helps manage and control your business more effectively. They save time, help solve problems and support decision-making that impacts bottom-line profitability.
The reports we’re highlighting are just four of the 200+ reports that come standard with every MyPOS Connect system, and they can be accessed in the Back Office Manager module or from the Reports Portal, or right from the POS screen (based on user security settings).
Now, without further ado, here are four reports that our customers tell us they love the most.
Dashboard Report
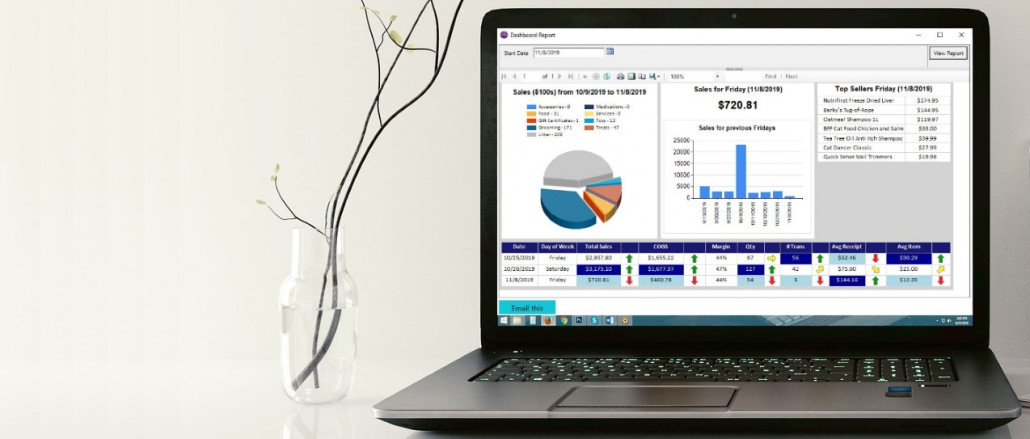
This is a high-level, visual overview of your sales on a chosen date, as compared to recent previous sales. It shows a pie graph that presents your sales by primary classification; a bar graph indicating how your sales on the selected date compare to sales on the same day of the week for previous weeks; it highlights your top sellers for the chosen date; and it displays a trending analysis for sales, COGS, Margin, and average sale and item amount. This report enables you to compare current sales performance to previous periods so that you can spot trends immediately and make proactive decisions.
Product Trend by Week
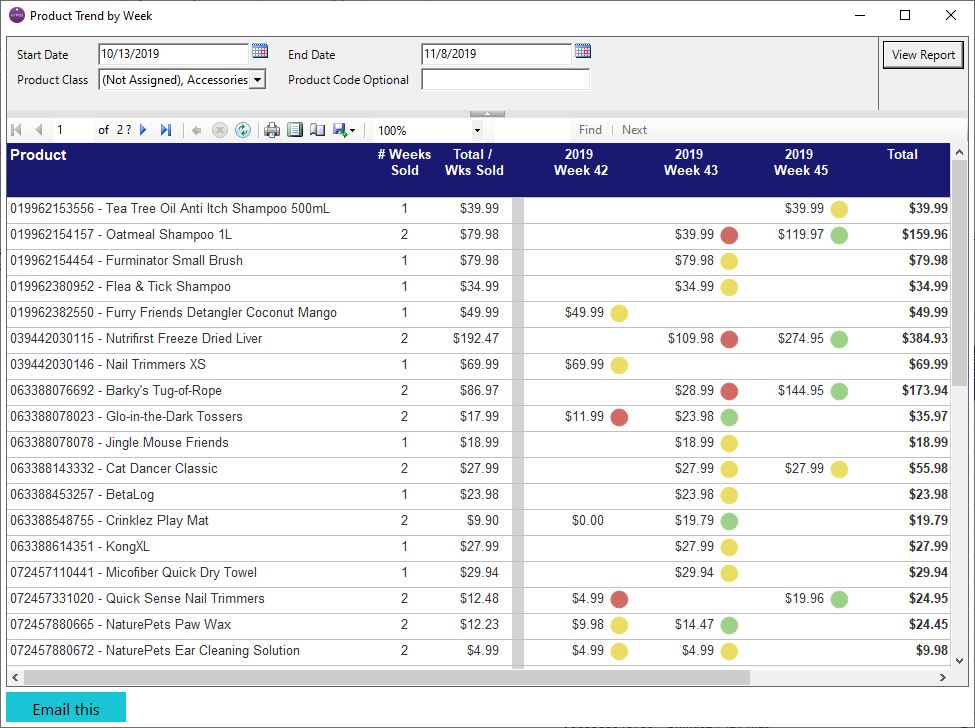
This is an overview of how each of your products are performing, from week to week, over a given date range. The report highlights each Product’s best weeks with a green marker, the worst weeks with a red marker, and the weeks with intermediate sales performance using a yellow marker. It’s a quick and easy way to help you decide what Products might need replenishing sooner. Many of our customers use this trending information to modify re-stocking information (min/max levels), which enables MyPOS Connect to generate more accurate suggested purchase orders.

Financial Detail
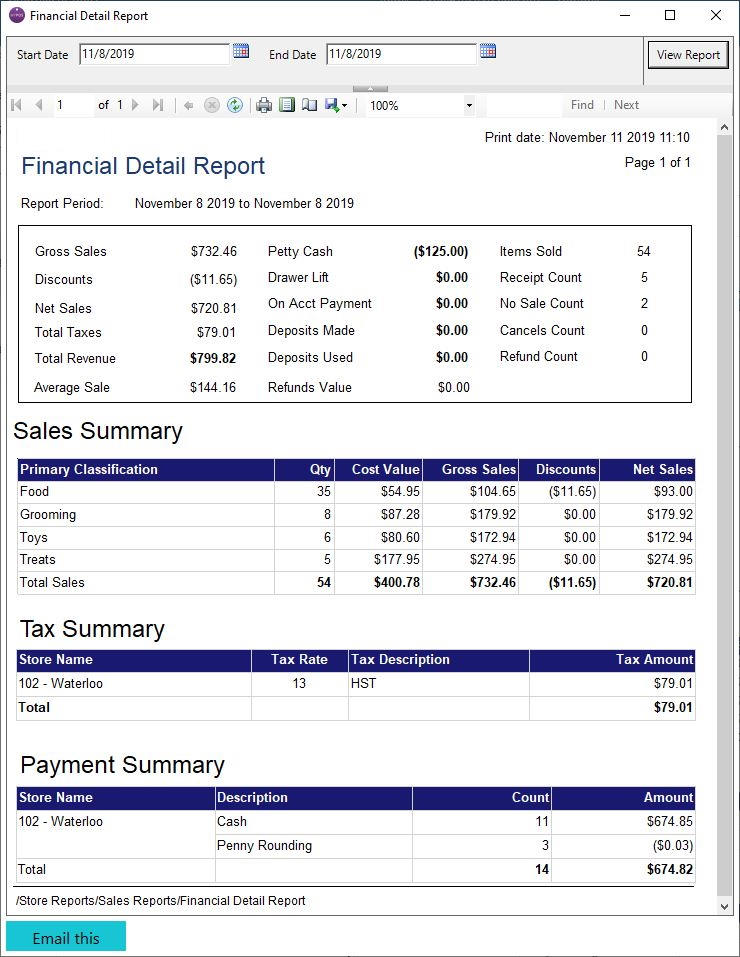
This report provides a picture of the financial performance of your store over a given date range. It provides generally the same information as the Z-Report that is printed at the till, but in a consolidated format that includes data from all POS stations. Customers use this report to post their accounting system and as an exception report to hone in on dishonest employees.
Product Movement
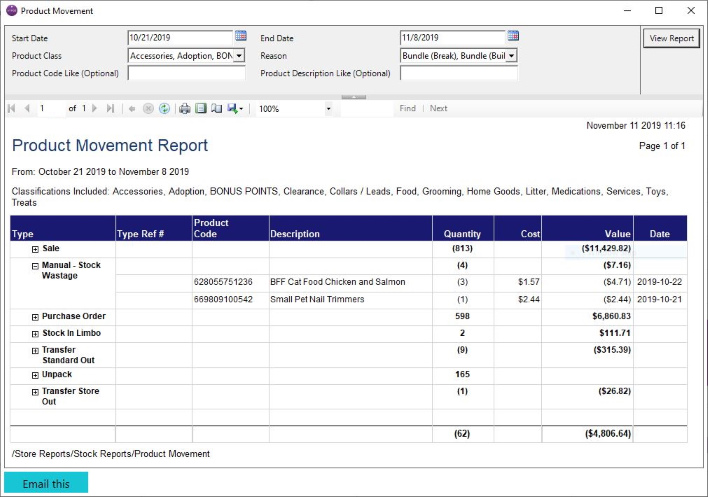
The Product Movement Report allows you to quickly determine everything that happens to your inventory. From initial order to final sale, all of the information is available in a single, easy to generate report. It’s especially helpful as a forensic tool for correcting Quantity On Hand errors in your system. Use this along with the Product Stock On Hand report to backtrack and narrow in on the exact quantity and value of your inventory for today and for any previous date.

With all of the information that MyPOS Connect Reports make available in seconds, you can be confident you have the best tools for the job. If you would like more information about these reports; or if you have an idea for a custom report you would like us to write for you, contact our Support Team at support@tricityretail.com or call us toll-free at (877) 877-4767.


